Types of Graphs: Posters - Rainbow Classroom Decor
Types of Graphs: Posters
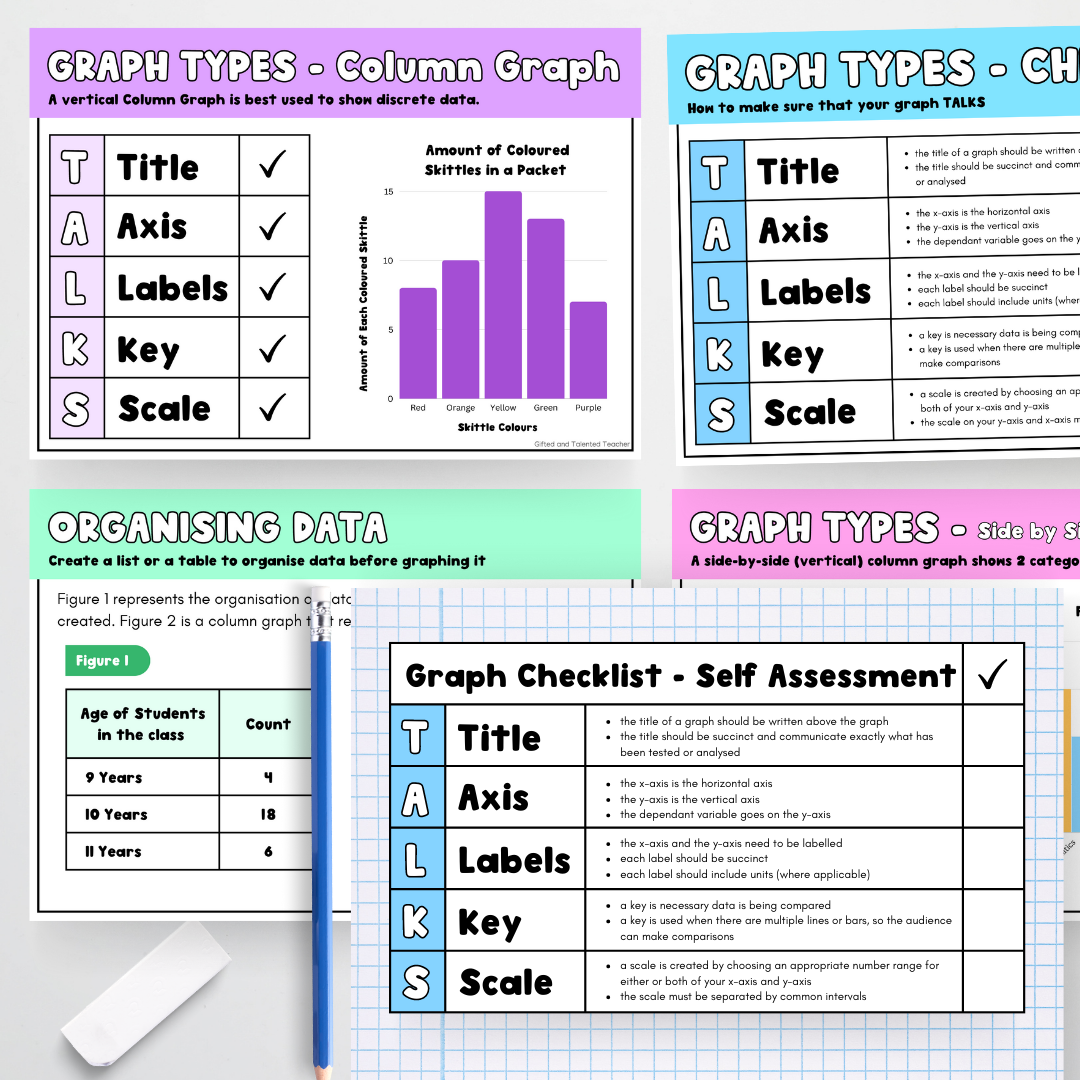
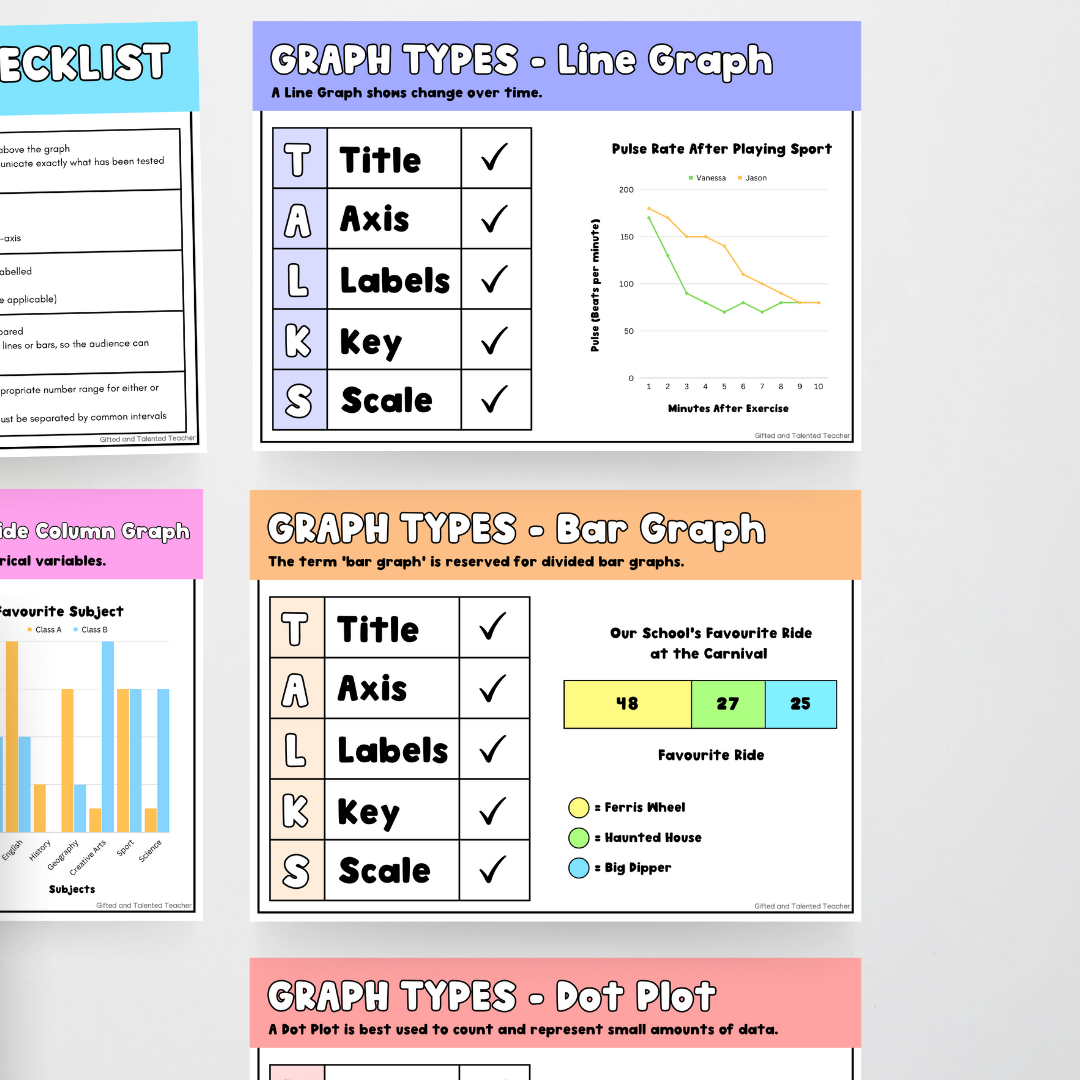
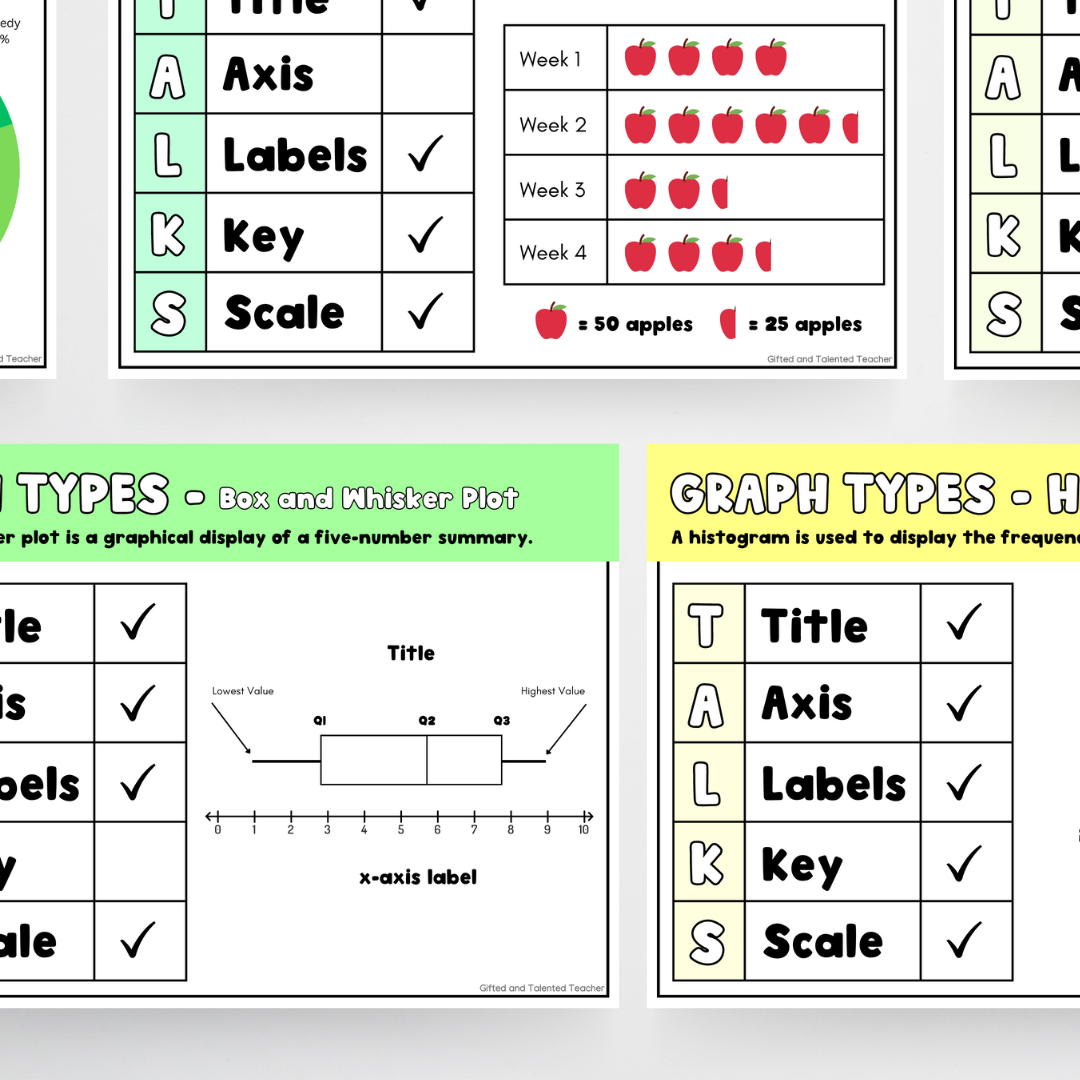
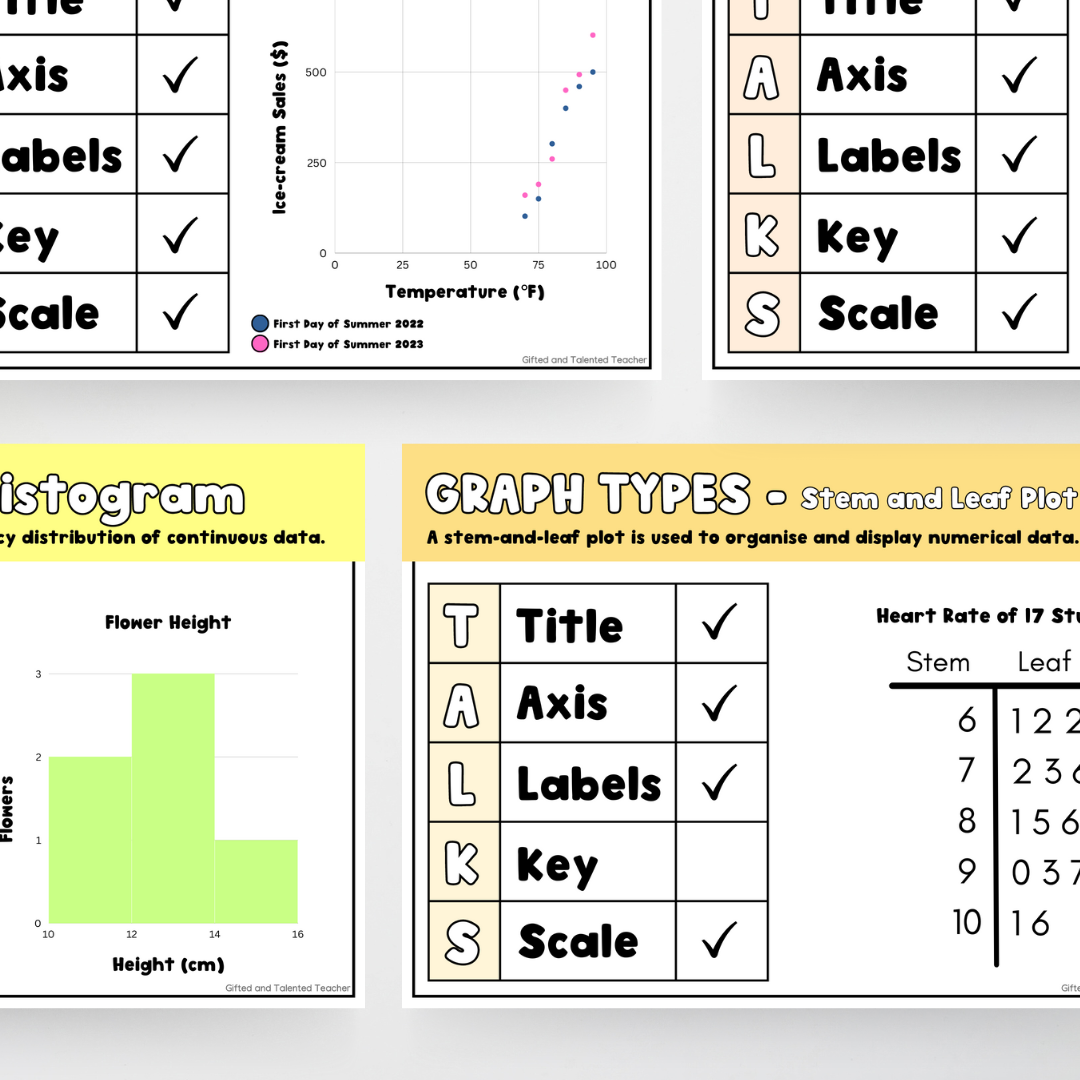
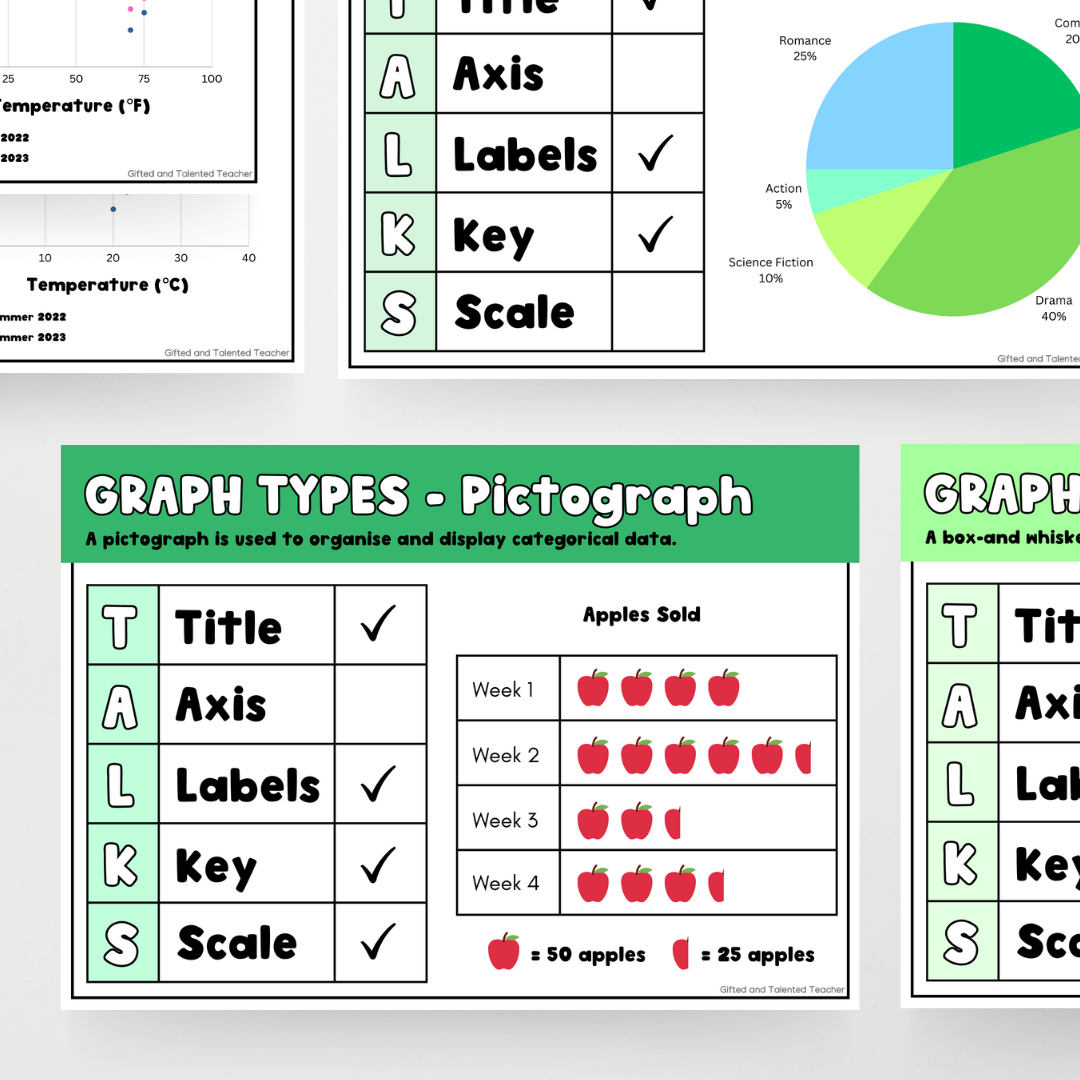
Teach students how to display data the correct way and in a variety of ways. A range of data displays have been included, as this resource is intended to be used across a range of grade levels. Each graph includes a consideration of the acronym 'TALKS'. This acronym reinforces the need (at times) to include a title, axis, labels, key and a scale.
What's included?
- Organising Data
- Line Graph
- Column Graph
- Side by Side Column Graph
- Bar Graph
- Dot Plot
- Divided Bar Graph
- Stem and Leaf Plot
- Histogram
- Scatter Plot
- Box Plot / Box and Whiskers Plot
- Pie Chart
- Picture Graph / Pictograph
- self, peer and teacher assessment checklists
Options include:
- colour/color banner vs black banner
- US and UK spelling e.g. 'colour' and 'color'
- Degrees Celsius and Degrees Fahrenheit
- Column Graph vs Bar Graph (horizontal and vertical options)
Format: PDF Posters and PNG Assessment Checklists

Types of Graphs: Posters - Rainbow Classroom Decor
Sale price
$6.20
Regular price (/)
